The Tableau for Data Visualization course is designed to provide you with the essential skills to create powerful, interactive visualizations using Tableau, one of the most popular data visualization tools in the market.
Tableau for Data Visualization
The Tableau for Data Visualization course is designed to provide you with the essential skills to create powerful, interactive visualizations using Tableau, one of the most popular data visualization tools in the market. Tableau empowers you to transform complex data into clear, actionable insights through visually appealing and intuitive tableau visualizations. Whether you're a business analyst, data scientist, or beginner looking to explore the world of data visualization, this course offers hands-on learning and practical techniques to help you leverage Tableau’s features.
Throughout this course, you will dive into using Tableau as a visualizer to create basic and advanced visualizations, build interactive dashboards, and use Tableau for business intelligence and reporting. You'll also explore how to optimize Tableau performance and learn best practices for efficient data visualizations. By the end of the course, you’ll be able to transform raw data into impactful visual representations that aid in business decision-making and strategic analysis.
This course is perfect for professionals who want to enhance their data visualization and business intelligence skills. It is especially beneficial for business analysts, data analysts, and anyone working with large datasets who wants to gain insights from their data through Tableau visualizations. Whether you are a beginner with no prior experience or an intermediate user looking to refine your skills, this course will guide you step-by-step in mastering Tableau. Additionally, it is ideal for professionals in fields such as marketing, finance, operations, and sales, where data-driven decision-making is key. No prior experience with Tableau is required, though basic knowledge of data concepts and analytics is helpful.
Understand the core principles of data visualization and the features of Tableau.
Connect to various data sources and prepare your data for visualization.
Create basic and advanced Tableau visualizations such as bar charts, scatter plots, heatmaps, and geographic maps.
Use calculated fields and advanced analytics to enhance your visualizations.
Design interactive dashboards that provide a dynamic and comprehensive view of your data.
Apply storytelling techniques with data to convey your insights effectively.
Utilize Tableau for business intelligence, including reporting and creating actionable insights.
Optimize Tableau workbooks for performance and apply best practices in visualization design.
-
Understand the fundamentals of Tableau for Data Visualization, the concept of data visualization, and how Tableau helps transform raw data into visual insights. Learn about Tableau’s interface and basic navigation.
-
Learn how to connect Tableau to different data sources such as Excel, SQL databases, and cloud services. Discover the techniques for preparing and cleaning data before creating visualizations.
-
Explore Tableau’s basic visualization options, including bar charts, line charts, and pie charts. Learn the fundamentals of creating effective tableau visualizations that are easy to interpret.
-
Dive into more complex visualizations such as heat maps, bullet charts, tree maps, and geographic visualizations. Learn advanced techniques for customizing visualizations to meet specific analytical needs.
-
Discover how to enhance your visualizations with calculated fields, aggregations, and table calculations. Learn how to apply advanced analytics techniques such as forecasting, trend analysis, and reference lines.
-
Master the art of creating interactive dashboards in Tableau. Learn how to use actions, filters, and parameters to make your dashboards dynamic and engaging. Explore techniques for storytelling with data to convey insights effectively.
-
Understand how Tableau can be used for business intelligence, reporting, and data-driven decision-making. Learn how to create reports and share your visualizations with stakeholders.
-
Learn best practices for optimizing Tableau performance, from data preparation to dashboard design. Explore strategies for working with large datasets and ensuring that your visualizations are efficient.
Earn a Professional Certificate
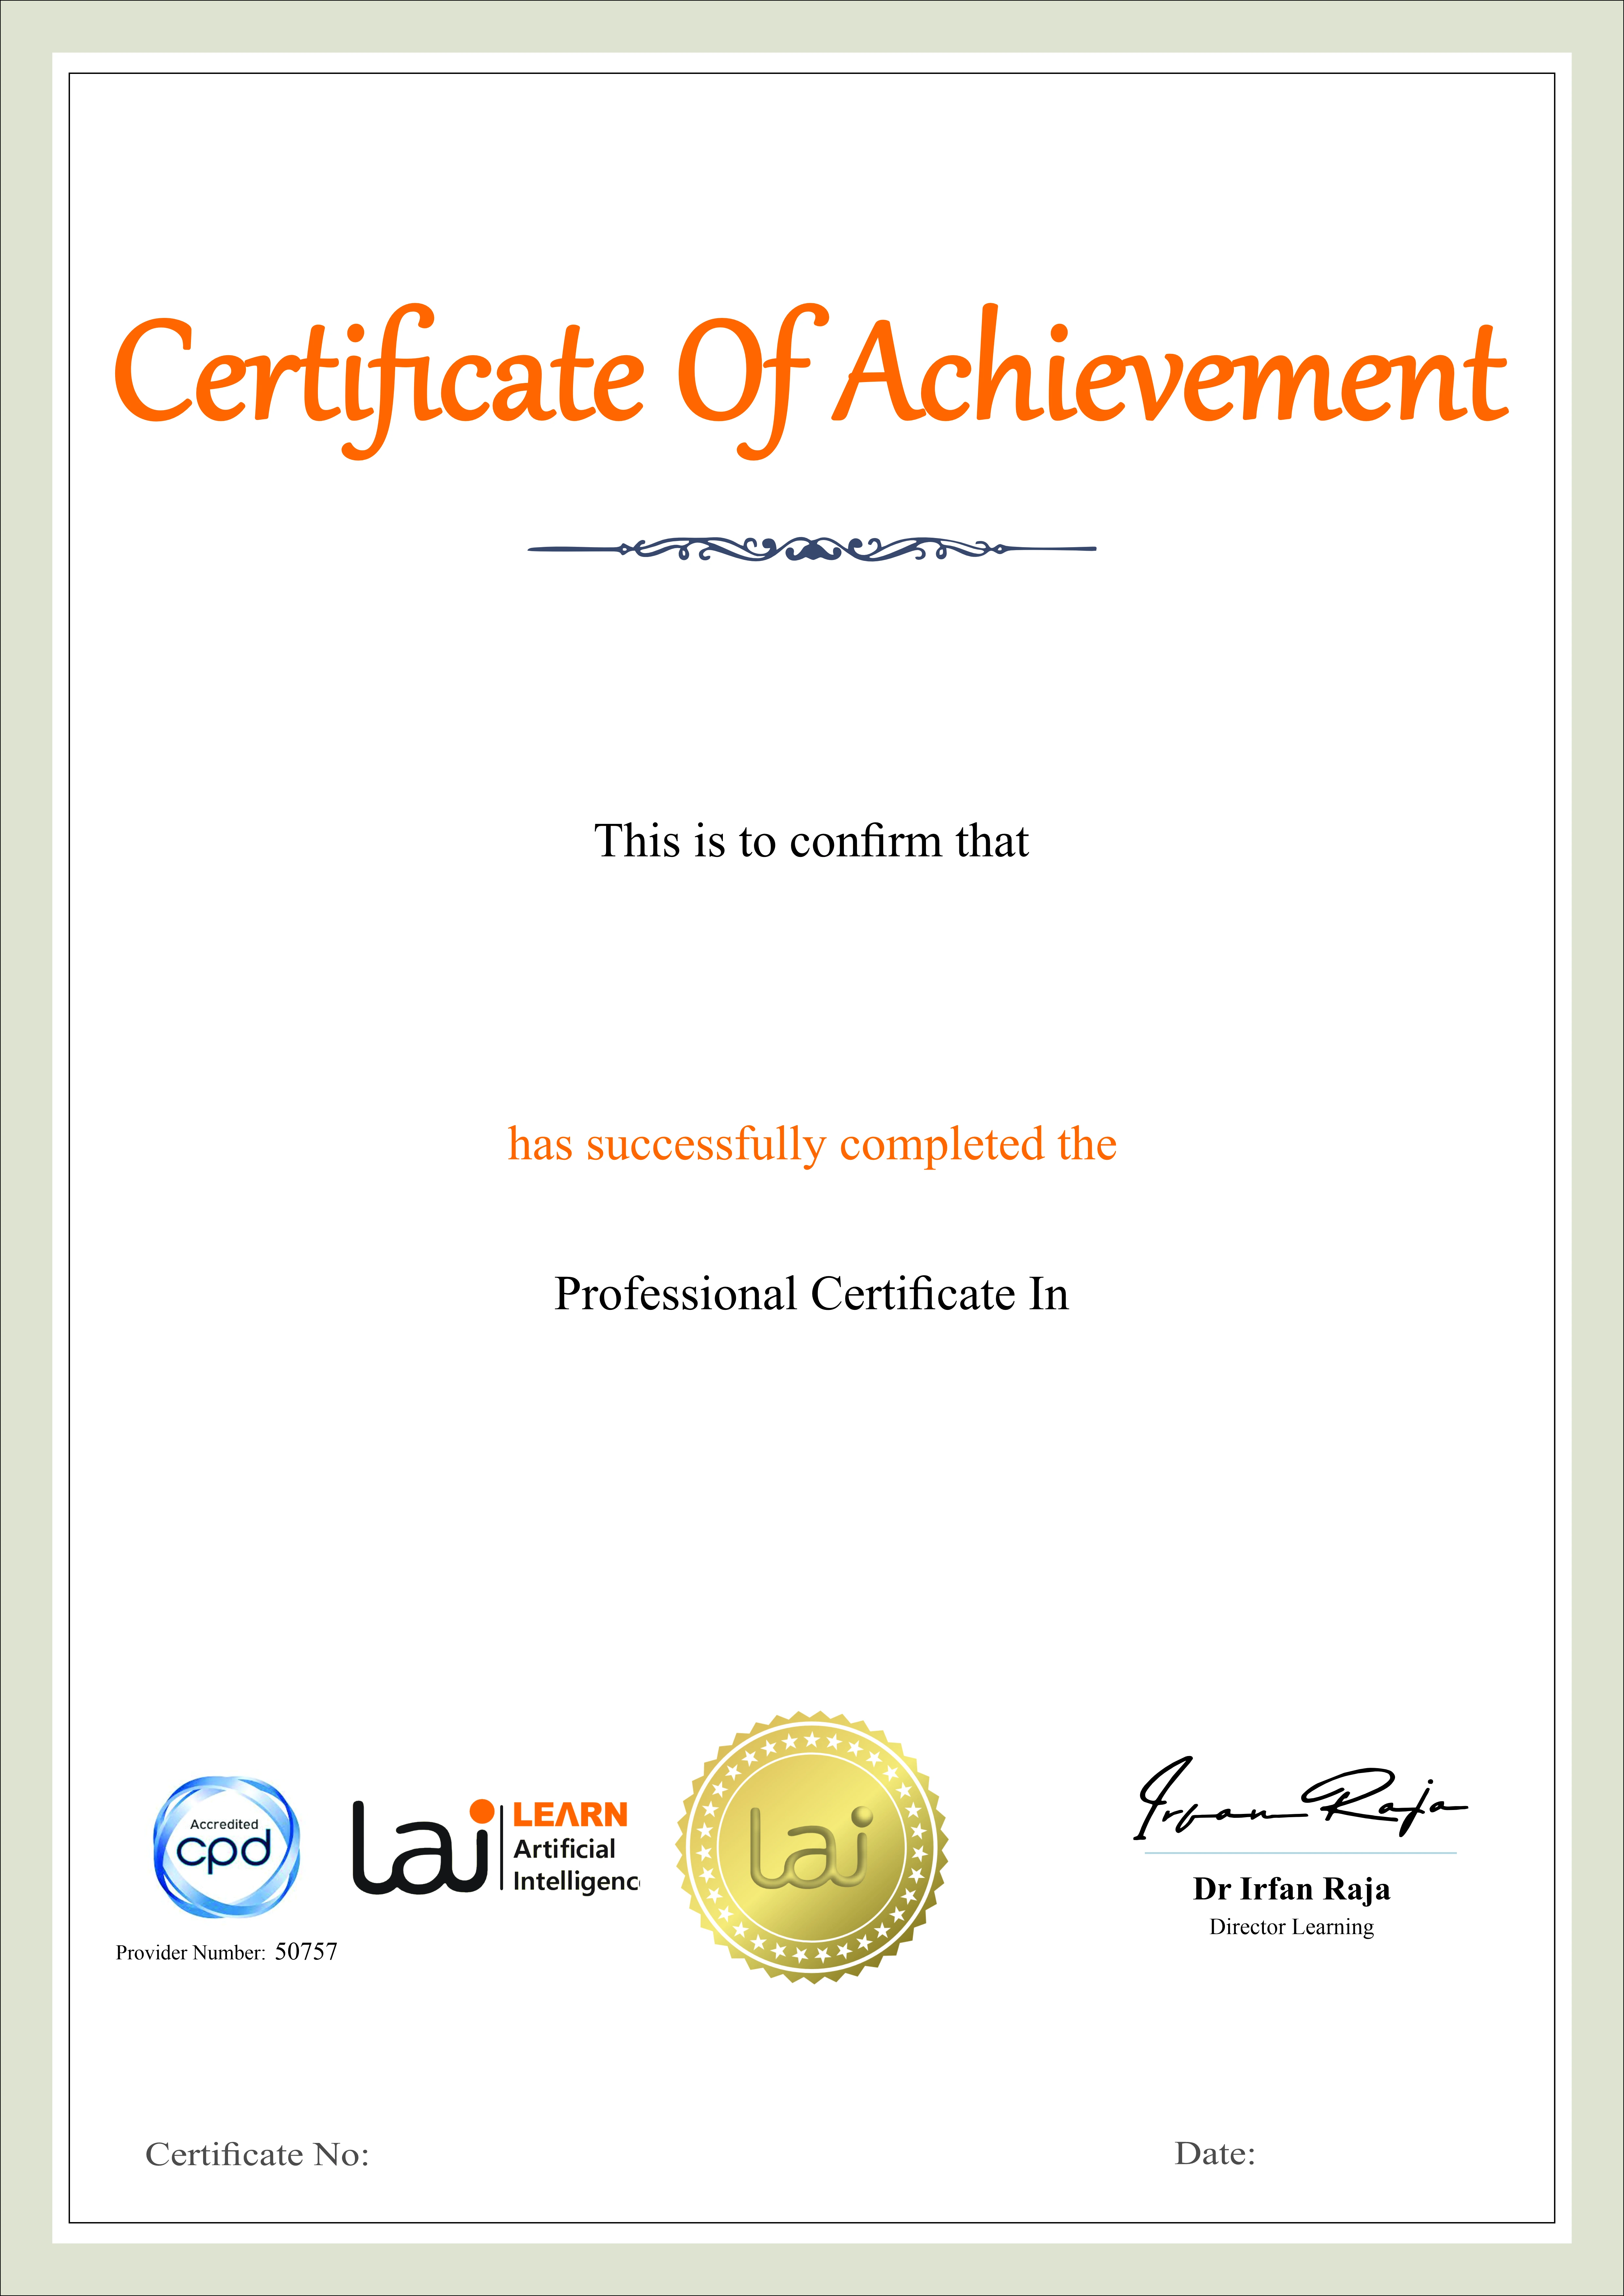
Earn a certificate of completion issued by Learn Artificial Intelligence (LAI), accredited by the CPD Standards Office and recognised for supporting personal and professional development.

Key Aspects of Course

CPD Accredited
Earn CPD points to enhance your profile

Free Course
This course is free to study

Self-Paced
No time limits or deadlines

Flexible & 24/7 Access
Learn anytime , anywhere

Build in demand job skills
Get job ready

Updated AI Skills
Stay current with AI advancement

Global Learning
Accessible Worldwide

Premium Materials
High-quality resources

Employer Approved
Boost your career prospects


